We analysed 98,518 cold calls. Connect rate varied sharply by local hour, attempt and weekday.
Twelve weeks of outbound dialling, one outcome per call, measured in the prospect’s own timezone. We tried to break each finding before publishing it, and we show you the two that partly broke.
The three findings
Every number on this page comes from one dataset, frozen at a stated cutoff and reconciled in full below. Where the data is thin, or a result looks like an artefact of how we work rather than a fact about cold calling, we say so.
1. Call at 8am in their time, not yours
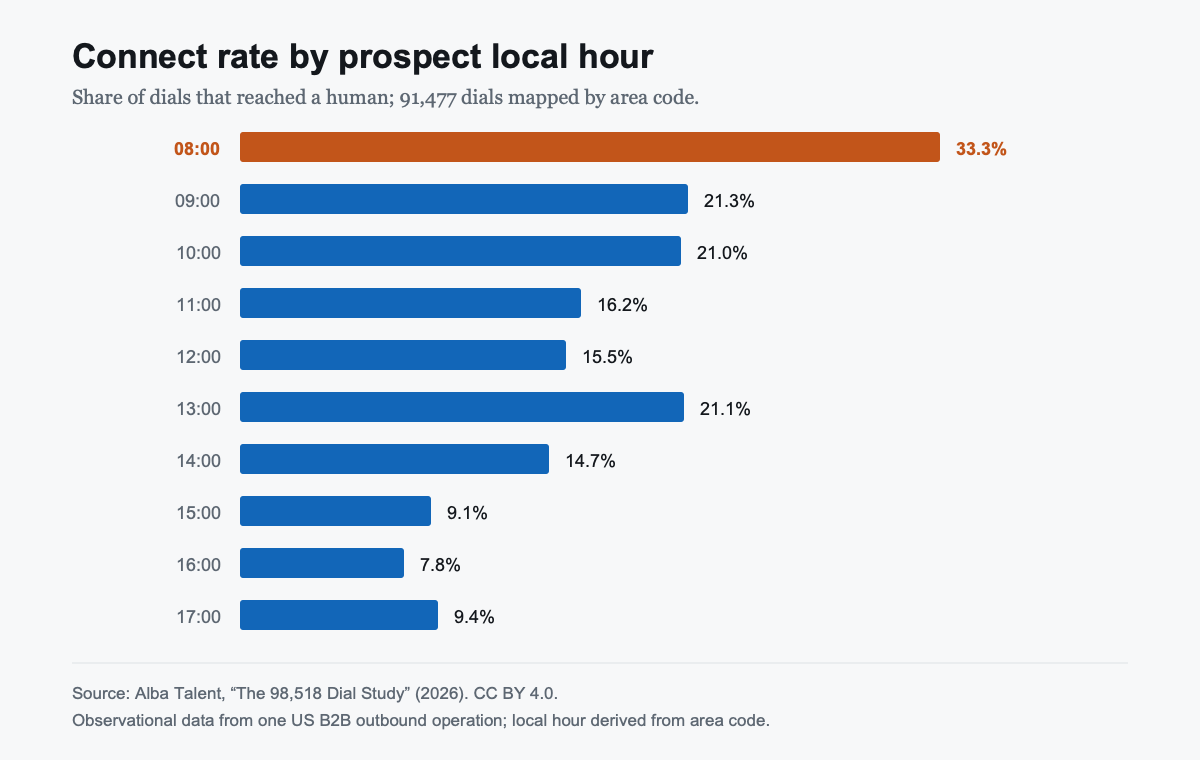
The most consistent effect we found, and the one that held up to every test we ran. Connect rate declines from 8am through the afternoon, with a clear recovery over lunch and a weaker one at 5pm. Every dial is placed in the prospect’s local hour, derived from area code, not the caller’s clock. Most published versions of this statistic never say whose clock they used.
| Prospect local hour | Reached a human |
|---|---|
| 8am | 33.3% |
| 9am | 21.3% |
| 10am | 21.0% |
| 11am | 16.2% |
| 12pm | 15.5% |
| 1pm | 21.1% |
| 2pm | 14.7% |
| 3pm | 9.1% |
| 4pm | 7.8% |
| 5pm | 9.4% |
We tried to break this one before publishing it
The obvious objection: dialling floors start fresh lists in the morning, and first dials answer far better than repeat dials. So is 8am really the first-dial effect wearing an hour-of-day costume?
We stratified by attempt number to find out. Within first dials only, 8am returns 38.4% against 10.9% at 4pm, a factor of 3.5. The effect holds independently inside repeat dials too, at 17.6% against 4.0%. It also survives per caller: six of our nine callers had meaningful volume in both windows, and five of those six reach more people in the morning.
The hour effect is not the attempt effect.
The 1pm recovery is the second most interesting bar on the chart. Connect rate falls through the late morning, jumps back to 21.1% over lunch, then collapses through the afternoon to a low of 7.8% at 4pm. If you dial a single hour a day, dial 8am. If you dial two, add 1pm, not 4pm.
2. The first dial is worth nearly four second dials
Across all dials, reaching a human falls from 22.1% on the first attempt to 10.8% on the second and 5.2% on the third. That looks like a clean case against persistence, and taken at face value it would be wrong, so we checked it before believing it.
Most of that decline is survivorship
Numbers that answer leave the redial pool. Numbers that never answer accumulate attempts. So the population at attempt five is, by construction, the population that has already proved hard to reach. The curve partly measures who is left, not what persistence does.
To separate them we fixed the cohort: only numbers that received six or more dials, where every number appears at every attempt and survivorship cannot operate. Inside that cohort the shape changes.
Two things survive. The first dial really is the best dial: 5.58% against 1.46%, a 3.8× advantage, on identical numbers with no survivorship available to explain it. And attempts two and three really are a dead zone, bottoming at 0.70%.
But the monotonic collapse does not survive. Inside the fixed cohort the curve turns back up from the fourth attempt: 1.14%, then 1.33%, then 3.36% at the sixth, close to three times the average rate across attempts two to five. Persistence does not fail. It stops working for a while and then starts again.
The operationally useful version, and the one we would stand behind: call once at the right hour, then either move on or commit properly. In the fixed cohort, the half-hearted second and third attempt is the worst use of a dial.
3. Wednesday beats Monday almost four to one
Day of week produced a spread nearly as wide as time of day. Because we already suspected Monday was an artefact of our own scheduling, we tested that too.
We tried to break this one too, and it held
Our hypothesis was that Monday looks bad because we dial it later: list preparation and weekly planning push Monday calling into worse hours. The data supports the premise. Monday’s mean local dial hour is 12.6 against 12.1 on Wednesday, and only 20.2% of Monday dials land between 8am and 10am against 26.2% on Wednesday.
But it does not explain the gap. Holding both days to the same 9am to 2pm local window, Monday returns 6.3% and Wednesday 27.3%. The hour mix accounts for very little of it. Monday is worse for reasons that are not hour mix, and that this dataset cannot identify. Note that the controlled gap, 4.3 times, is wider than the headline 3.9.
Method
Stated in enough detail to be checked or reproduced.
| Source | Alba Talent production dialler records |
|---|---|
| Window | 18 May 2026 to 11 August 2026, 86 days inclusive |
| Records in window | 109,049 call attempts, one outcome each |
| Analysed | 98,518 dials after exclusions |
| Reached a human | 16,429 (16.7%) |
| Distinct numbers | 60,054 |
| Callers | 9 |
| Market | United States, business-to-business |
The window is frozen deliberately. The dialler is live and the underlying table grows daily, so the study is cut at the last complete day before publication. Anyone re-running these queries later will see larger totals; the figures here describe the frozen window only.
“Reached a human” means the call ended in an outcome recording a person on the line: a conversation, a gatekeeper, a wrong contact, a refusal. It is deliberately broader than “a good call”. It measures whether the phone was answered, not whether the pitch worked.
Exclusions reconcile exactly, and the chain starts from every record we hold. At the moment of the freeze the dialler table held 132,570 attempts. 22,316 carried no usable timestamp and cannot be assigned to any window, so they are removed first; a further 1,205 fall outside the window. That leaves 109,049 in-window records, from which 9,911 marked cancelled and 620 with no recorded outcome are excluded, giving 98,518. Note that only 1,205 timestamped records fall outside the window at all: this is very nearly our entire dialling history to date, not a period selected after seeing the results. Cancelled records are dials abandoned before connection rather than attempts: they average 0.8 seconds. Including them would cut every rate by about a tenth, from 16.7% to 15.1%, without describing anything real.
Attempt numbering is within-window. A number first dialled before 18 May appears here as a first dial, because the sequence is computed inside the frozen window rather than over the table’s full history. Distinct numbers and first dials are therefore equal by construction, both 60,054.
Timezones. Local hour is derived from the North American area code and a fixed UTC offset per zone. The window sits entirely within daylight saving, so offsets are constant throughout. 91,477 dials mapped, 92.9%, using a 284 area-code table. The remainder are excluded from the time-of-day chart only.
Limitations
- One firm, nine callers, twelve weeks. This is a large sample of one operation, not a cross-industry survey. Our ICP, lists and scripts are inside every number here.
- Area-code timezones break on ported and VoIP numbers. A 617 mobile carried to California still reads as Eastern here. We cannot measure how many, and it adds noise to the local-hour chart in an unknown direction.
- The fixed cohort is small. 1,578 numbers, and the sixth-attempt recovery rests on 53 conversations. It is the least certain number on this page.
- The 8am cell is the smallest one shown at 2,899 dials. It is the strongest effect we measured and the one we would most like to see someone else replicate.
- Dispositions are entered by the caller on top of the dialler’s own answered and no-answer flag, so the granular outcomes carry human judgement.
- We have not tested causation. Nothing here establishes that moving dialling to 8am would produce a 33% connect rate. It establishes that 8am dials in this dataset did.
Download, cite and reuse
Dataset release 1.0 contains the aggregates published on this page, not contact-level records. The analysis window remains frozen; this page was updated on 31 August 2026 to add stable research assets.
Aggregate data
Long-form CSV containing every published rate, count and stated denominator. Blank denominators remain blank rather than being inferred from rounded percentages.
Download aggregate CSVMethod and dictionary
Plain-text definitions, exact exclusions, field descriptions, limitations and reuse requirements.
Download source noteReusable chart
Accessible SVG of the hourly result, derived only from the published aggregates and labelled with the study scope.
Download chart SVG Download chart PNG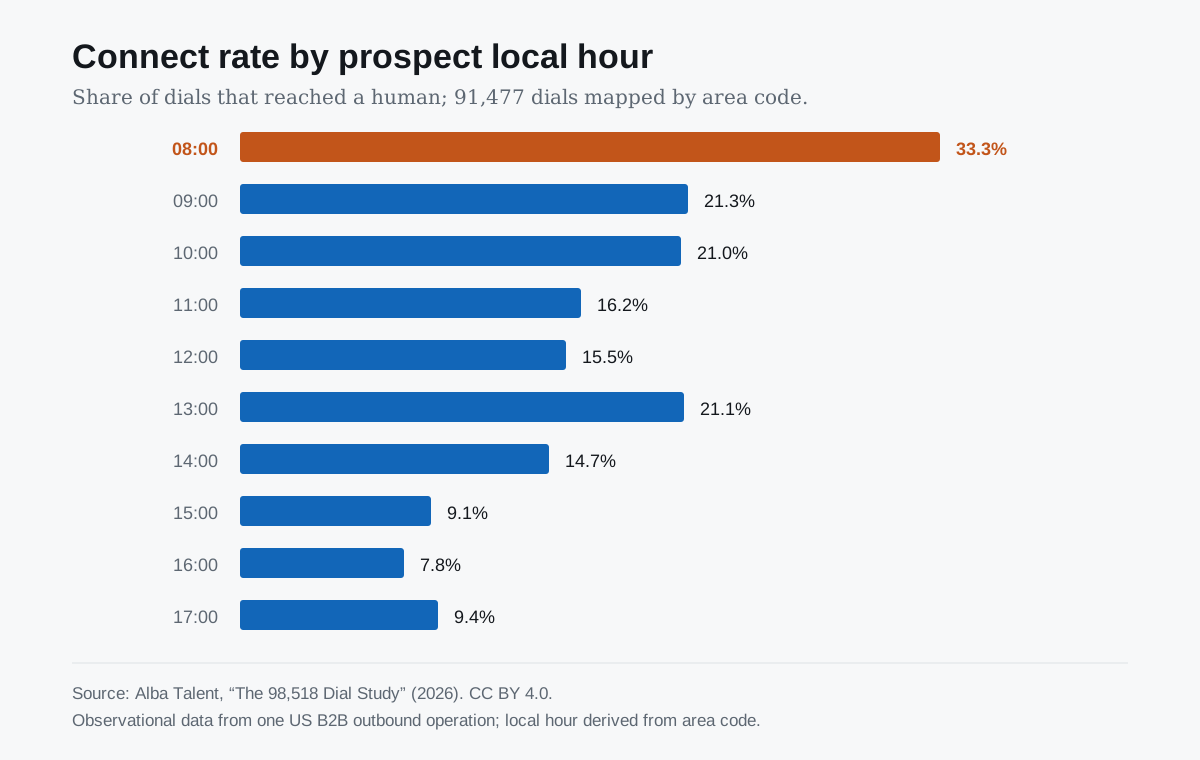
BibTeX
A citation file for reference managers, using this page as the stable canonical source.
Download BibTeXSuggested citation
Alba Talent, “The 98,518 Dial Study” (2026). Analysis of 98,518 US B2B cold calls placed 18 May to 11 August 2026. https://albatalent.io/research/98518-dial-study.
@misc{alba_talent_98518_dial_study_2026,
  author = {{Alba Talent}},
  title = {The 98,518 Dial Study: What 98,518 Cold Calls Show},
  year = {2026},
  url = {https://albatalent.io/research/98518-dial-study},
  note = {Dataset release 1.0; frozen window 18 May--11 August 2026; CC BY 4.0.}
}The article, aggregate CSV and chart are available under CC BY 4.0. When reproducing them, retain the prospect-local-time basis, the one-firm scope and the observational limitation. Do not relabel connect rate as meetings, pipeline or revenue, and do not present these aggregates as a universal industry benchmark.
If you replicate any of this on your own dialler data, particularly the 8am result or the Monday gap, compare it against the same definitions and frozen-window method.
What this study does and does not support
This study measures when a dial reached a person. It does not measure meeting quality, pipeline or revenue, and it cannot establish that changing the call hour causes a particular result.
For the operating context around lists, caller work and recording review, see how Alba scopes managed B2B cold calling. For staffing, oversight and pricing across multiple callers, see the 3-to-5-caller outsourced SDR team model. Those pages describe the service; this page remains the frozen evidence behind the connect-rate findings.